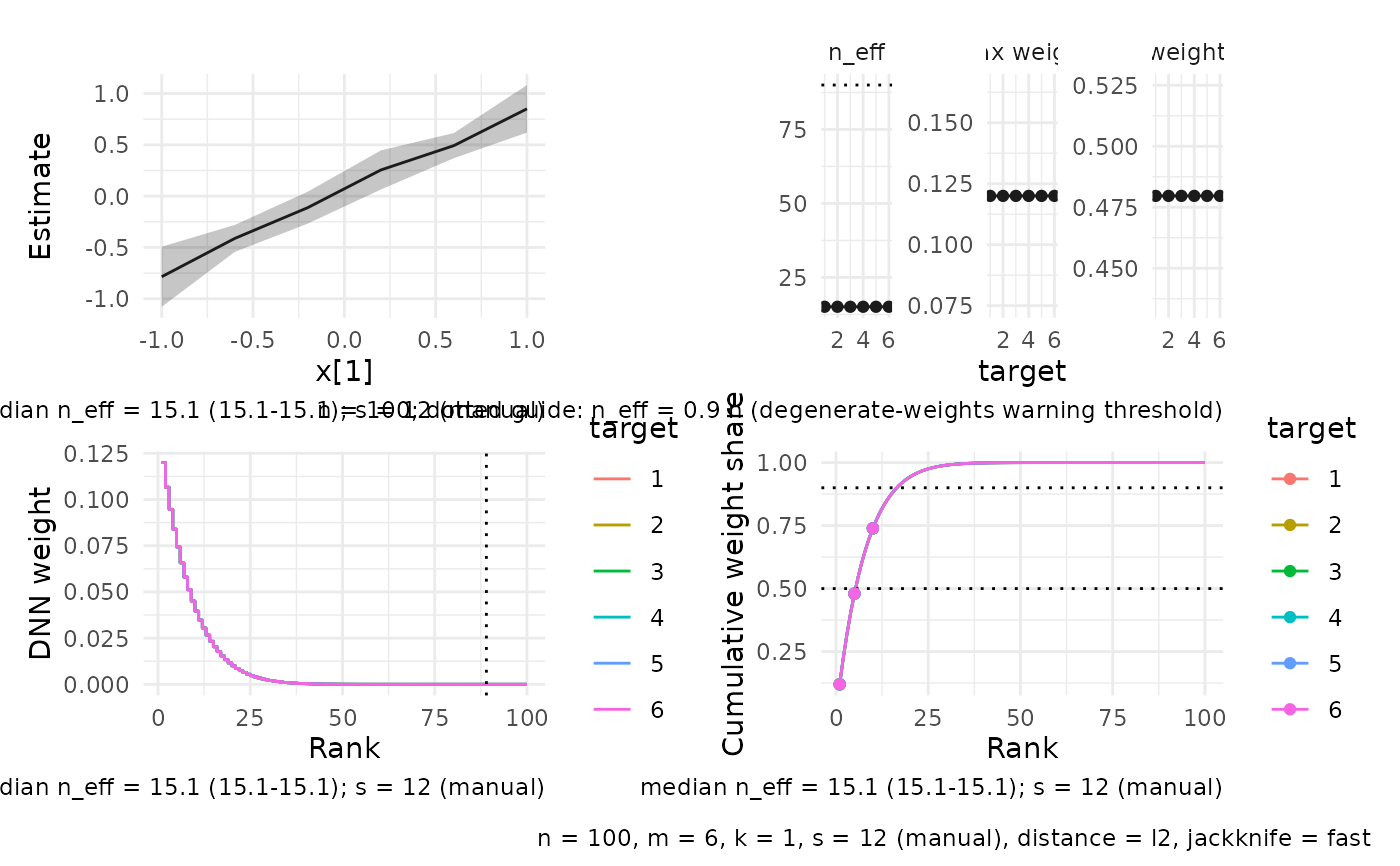
A patchwork composition of the estimate panel with the weight and
overlap diagnostics, annotated with the fit's metadata (n, m, k,
s with provenance, distance, and jackknife type). CATE dashboards use
estimates, overlap mass, local propensity, and cumulative weight share;
nonparametric-regression dashboards use estimates, the diagnostics
facets, and the weight decay and concentration views. Panels whose
inputs are unavailable are substituted (the diagnostics facets take the
place of a missing overlap panel) or dropped rather than failing the
dashboard.
Usage
plot_dashboard(object, ...)

# Default S3 method
plot_dashboard(object, ...)

# S3 method for class 'cate_result'
plot_dashboard(object, ...)

# S3 method for class 'np_result'
plot_dashboard(object, ...)
Arguments
- object
A fitted result object (
cate_resultornp_result).- ...
Passed on to
plot_estimates()for the estimates panel.
Details
When patchwork is not installed the panels are returned as a named list of ggplot objects with a message.
Examples
if (requireNamespace("ggplot2", quietly = TRUE) &&
    requireNamespace("patchwork", quietly = TRUE)) {
  set.seed(1)
  n <- 100
  x_mat <- matrix(rnorm(n * 2), n, 2)
  y_vec <- x_mat[, 1] + rnorm(n, sd = 0.3)
  fit <- np_dnn(
    X = x_mat, X0 = cbind(seq(-1, 1, length.out = 6), 0), Y = y_vec,
    k = 1L, s = 12L, return = c("W", "dx")
  )
  plot_dashboard(fit)
}