Plot DNN weight profiles, concentration, and effective kernels
Source:R/plot-weights.R
plot_weights.RdThree views of the localization weights stored on a fitted object.
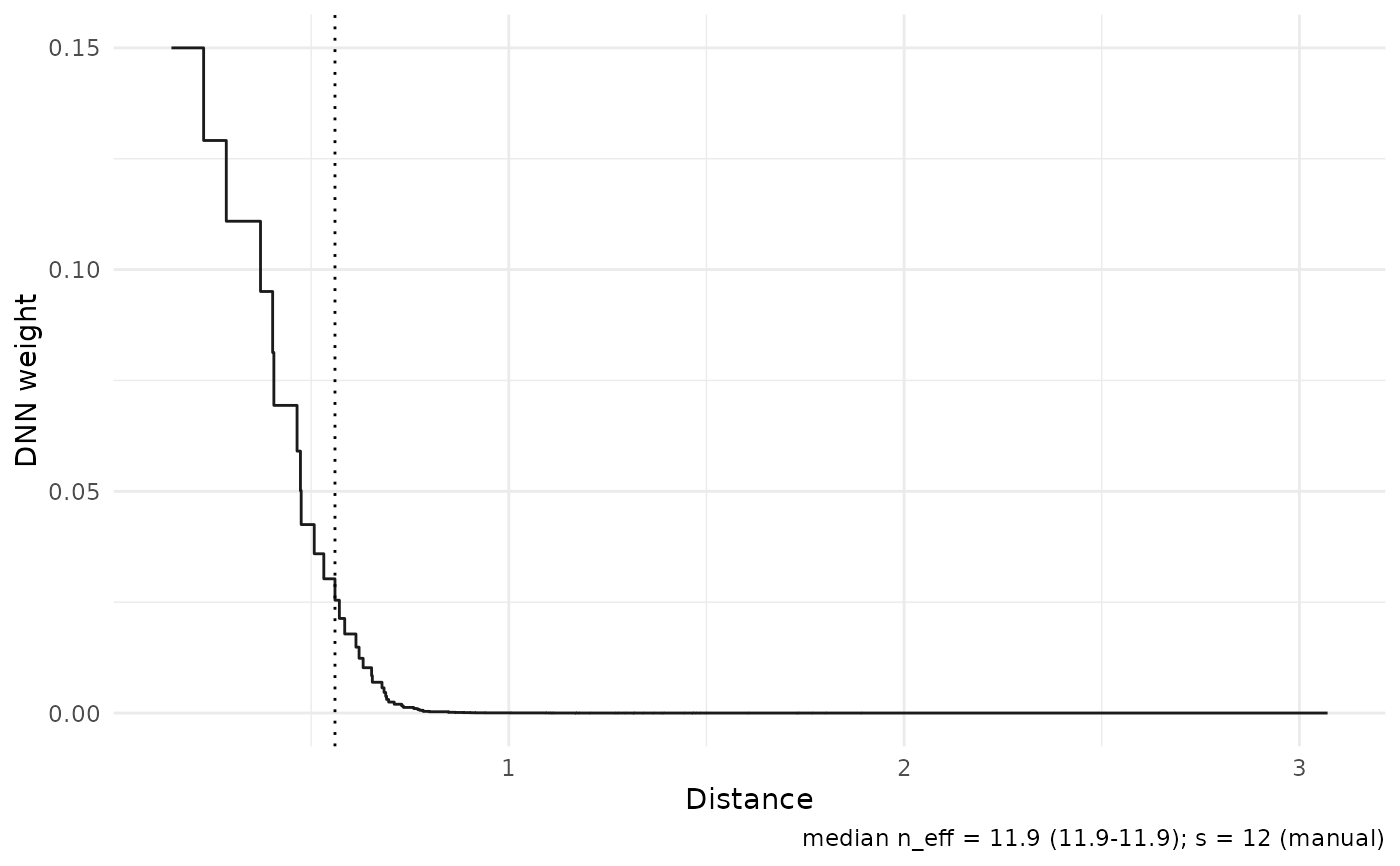
type = "profile" draws weight against rank with a guide at the exact
finite-population support edge n - s + k for DNN fits (n - s + 1 in
the paper-default k = 1 case); type = "cumulative" draws the
cumulative weight share with guides at 0.5 and 0.9 and markers at the
top-1/5/10 shares; type = "kernel" draws weight against stored distance
— the effective data-driven kernel — with a guide at the rank-s radius.
The rank-s radius is a scale diagnostic, not the DNN support radius.
Usage
plot_weights(
  object,
  type = c("profile", "cumulative", "kernel"),
  targets = NULL,
  log_weights = FALSE,
  candidates = "default",
  ...
)
Arguments
- object
A fitted result object holding the weight matrix
W(stored by default;type = "kernel"additionally requires stored distances viareturn = c("W", "dx")).- type
One of
"profile","cumulative", or"kernel".- targets
Optional integer vector of target ids to display.
- log_weights
Logical (default
FALSE); for rank-domain views, drop non-positive weights and use a log10 y scale (the number of dropped weights is reported in the caption).- candidates
Candidate rows to compare for grid fits. The default
"default"preserves the stored weight-matrix display. Use"all"or a character vector of candidate ids withtype = "profile"to compare rank-weight profiles without refitting.- ...
Ignored; reserved for future options.