Plot local design conditioning for PLQR fits (experimental)
Source:R/plot-conditioning.R
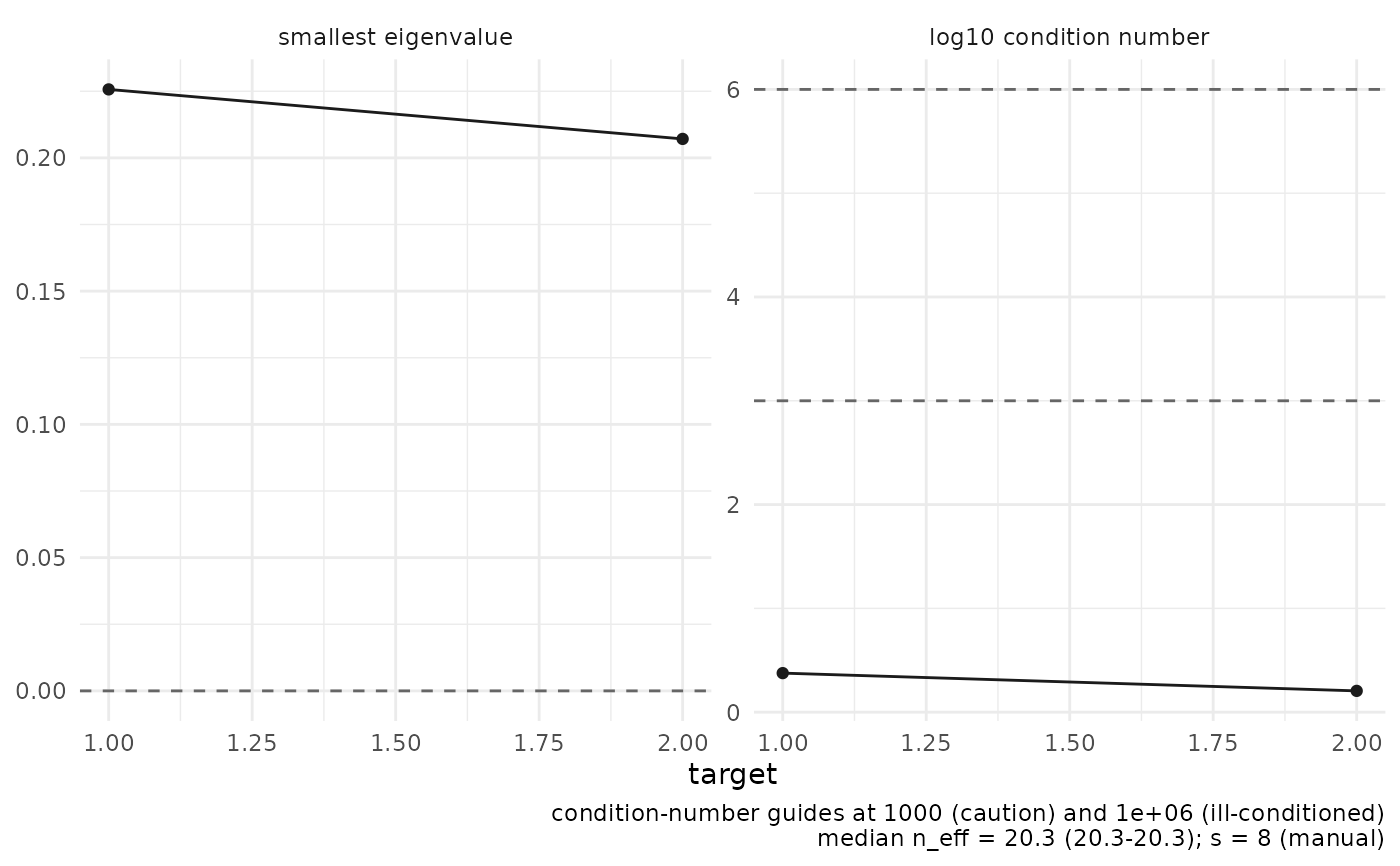
plot_conditioning.RdTwo facets across targets: the smallest eigenvalue of the weighted
residualized-design Gram matrix (linear scale, guide at zero) and its
condition number (log10 scale, dashed guides at cond_limits, labelled
caution and ill-conditioned). This is the software face of the local
design-conditioning diagnostics: a well-conditioned local Gram is what
makes the moment evaluation (and later inversion) trustworthy.
Usage
plot_conditioning(object, cond_limits = c(1000, 1e+06), ...)Arguments
- object
A
plqr_resultfromplqr_dnn().- cond_limits
Numeric length-2 vector (default
c(1e3, 1e6)); dashed guides drawn at these condition numbers.- ...
Ignored; reserved for future options.
Lifecycle
Experimental. PLQR functionality is outside the CATE and regression workflow focus of the initial public release. Its API and inference interfaces may change in later releases.
Examples
if (requireNamespace("ggplot2", quietly = TRUE)) {
  demo <- plqr_demo_data(n = 90, p = 2, p_d = 2, tau = 0.5, seed = 1)
  df <- demo$data
  fit <- plqr_dnn(
    X = as.matrix(df[paste0("X", 1:2)]),
    D = as.matrix(df[paste0("D", 1:2)]),
    g = as.numeric(df$g_oracle),
    mD = as.matrix(df[paste0("mD", 1:2)]),
    Y = as.numeric(df$Y),
    theta_eval = demo$truth$theta_true, tau = 0.5,
    X0 = rbind(c(0, 0), c(0.5, 0.5)), k = 1L, s = 8L, se = FALSE
  )
  plot_conditioning(fit)
}